Mapping External GeoJSON Data
Leaflet.js is a powerful, light-weight javascript API for mapping. In this post, I'll walk through how to use Leaflet to map GeoJSON data.

This post references in-page map functionality that we carry over from the old site.
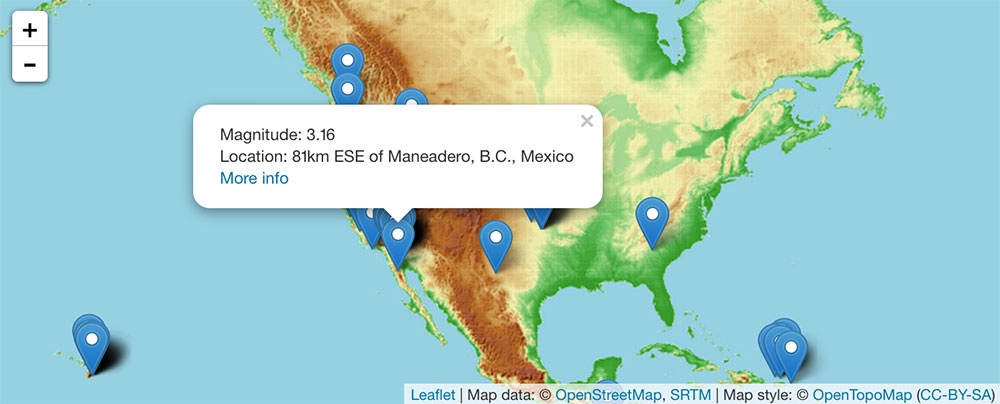
Leaflet.js is a powerful, light-weight javascript API for mapping. In this post, I’ll walk through how to use Leaflet to map GeoJSON data. By the end, we’ll have a map of earthquakes in the past 24 hours (using live USGS data) which looks like this:
This section largely duplicates the basic Leaflet set-up at this tutorial, except for we also add a Leaflet-providers plugin to get easy access to additional tilesets.
The first step in any mapping project using Leaflet is to add a basic div to your page with id=map. Leaflet will grab onto this div and insert the map content dynamically. You’ll need to fix the div size using CSS:
#map {
height: 300px; // Or whatever height you like
width: 100%;
}
Next, we need to add Leaflet javascript and CSS and jQuery javscript to the page. jQuery is needed here to load external GeoJSON through an AJAX call. In a production site, you might want to host these libraries locally.
<link rel="stylesheet" href="http://cdn.leafletjs.com/leaflet-0.7.3/leaflet.css"/>
<script src="http://cdn.leafletjs.com/leaflet-0.7.3/leaflet.js"></script>
<script src="http://code.jquery.com/jquery-1.11.3.min.js"></script>
The bulk of the mapping work will take place in custom javascript, which we can either place inline in the HTML file, or in a separate source file. We’ll create a leaflet map object:
var map = L.map('map');
Next, we need to add a background layer, or basemap. I like to do this using the leaflet-providers plug-in, which gives an easier way to add basemaps from multiple providers without having to manually specify the URL template strings for each layer.
Download the leaflet-providers.js file, and save it in the same directory as your working HTML file. In a real site, I would be using bower and browserify to manage packages, but that’s a topic for another post entirely. Place this code after the previous script tags.
<script src="leaflet-providers.js"></script>
With leaflet-providers included, we can add a number of different basemaps. Here we’re using free OpenTopoMap tiles.
var terrainTiles = L.tileLayer.provider('OpenTopoMap');
terrainTiles.addTo(map);

// Set the initial viewport of the map. Here we're centering on Savas Labs' hometown and zooming out a bit.
map.setView([35.9908385, -78.9005222], 8);
Whether you’re pulling in GeoJSON from external data source or hosting it locally, you’ll need to load the data using AJAX. jQuery provides a standard getJSON function, which will load JSON from an external source and then fire a callback once the data has loaded. In this example, I’m using the USGS geoJSON feed of all recorded earthquakes in the past 24 hours.
function addDataToMap(data, map) {
  var dataLayer = L.geoJson(data);
  dataLayer.addTo(map);
}

$.getJSON("http://earthquake.usgs.gov/earthquakes/feed/v1.0/summary/all_day.geojson", function(data) { addDataToMap(data, map); });
The callback creates a new Leaflet layer object by calling L.geoJson, and then adds that layer to the map.
Note that within jQuery, JSON is in all caps, whereas Leaflet uses strict camelCase (geoJson).
We need to access the map variable inside addDataToMap, so I’m using a closure here to pass that along with the data. This is usually not strictly necessary, since depending on how your javascript is written, map is probably already available within the scope of addDataToMap. But let’s explicitly pass it here, to avoid being confusing.
Wouldn’t it be nice to be able to click on some of those points and find out more details about the earthquake? So far we haven’t made use of any, but Leaflet allows you to pass a variety of callbacks as options to L.geoJson. These include:
pointToLayer( GeoJSON featureData, LatLng latlng )- Called once for each point feature in the geoJSON. Use this to create a custom marker when data points are added to the map. Returns L.Marker object.
onEachFeature( GeoJSON featureData, ILayer layer )- Called after each feature is created and on the map. Use this to add event listeners to the feature.
filter( GeoJSON featureData, ILayer layer )- Called once for each feature in the dataset to determine whether it should be displayed on the map or not. Returns a boolean true if the feature should be displayed, false otherwise.
coordsToLatLng( Array coords )- Translates whatever coordinates are in the geoJSON file into latitude and longitude coordinates in WGS 84. Necessary if your GeoJSON data is in a different coordinate system. Returns a LatLng object.
style( GeoJSON featureData )- Generates CSS which applies to the marker for the feature with data
featureData. Returns CSS in the form of a JavaScript object.
- Generates CSS which applies to the marker for the feature with data
Here, we’ll modify addDataToMap to use onEachFeature to bind a popup to each feature as it is added. In general with GeoJSON you’ll find additional data associated with each point in feature.properties. I’m using the USGS properties to add a popup giving the precise location, magnitude, and link to more info for each earthquake.
function addDataToMap(data, map) {
  var dataLayer = L.geoJson(data, {
      onEachFeature: function(feature, layer) {
          var popupText = "Magnitude: " + feature.properties.mag
              + "<br>Location: " + feature.properties.place
              + "<br><a href='" + feature.properties.url + "'>More info</a>";
          layer.bindPopup(popupText); }
      });
  dataLayer.addTo(map);
}
And here’s the “finished” map! Stay tuned for more GeoJSON + Leaflet tutorials from Savas Labs.
The final HTML file with inline javascript is also posted as a gist here.


